We are three weeks into the NFL season and there are five teams still with a perfect record. The Bills have re-inserted themselves into the Super Bowl conversation while Sam Darnold and the Vikings continues to crush on the offense. Let’s take a look at those QBs and the best ones by EPA per dropback this season.

If you could crown a MVP in Week 3 of the season, it would go to Josh Allen. Similarly, Jayden Daniels would be awarded rookie of the year, especially after his performance against the Bengals. Caleb Williams is off to a slow start with the Bears and Trevor Lawrence is hoping (and expecting) a big turnaround sooner rather than later. Who will fall on this list and who will rise by the end of the season?

How much are your players adding when being targets this season? Well after Jauan Jennings performance Sunday afternoon, he leads the NFL in EPA per target. While he might not stay atop the list, the 49ers still have the ability to be efficient without their best weapons.
De’Von Achane is the first running back on the list and brings a great receiving option out of the backfield in Miami.

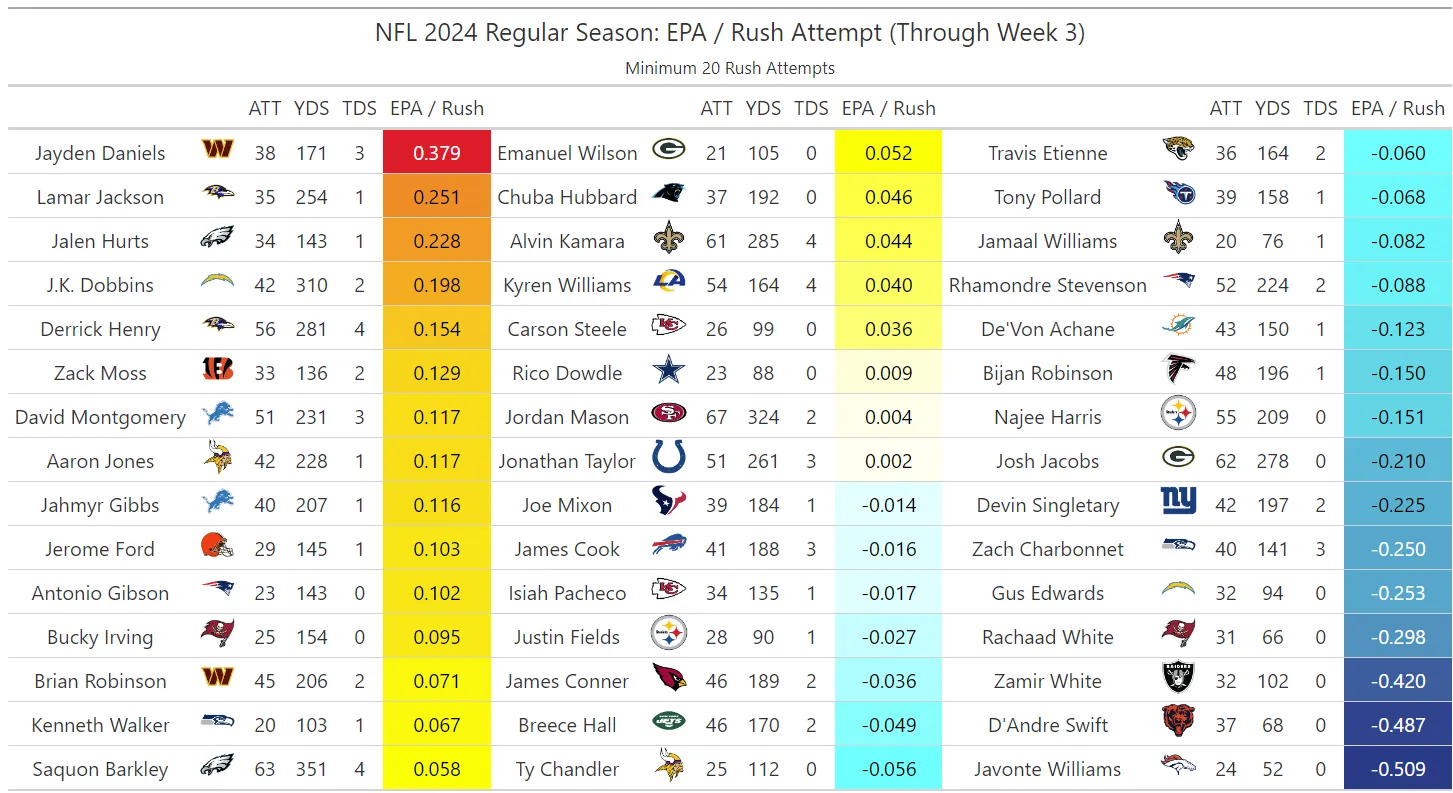
It is always interesting to see that three quarterbacks lead the league in EPA per rushing attempt, but here we are. J.K. Dobbins is the first non-QB on the list and his efficiency behind that Chargers line is something to behold. The Lions RBs are in a great position and Derrick Henry charges up the leaderboards after having a monster day against the Dallas Cowboys.
What are some thing you noticed on the leaderboard this week?
Let’s take a look at some Remarkable notes to start the 2024 NFL season:
- The Commanders have scored on 64% of their drives this season — best in NFL; League Avg: 38%.
- The Dolphins have scored on 21% of their drives this season — worst in NFL; League Avg: 38%.
- The Bills are averaging 2.4 drives per TD this season — best Drives Per TD rate in NFL; League Avg: 5.0.
- The Bills defense has allowed a passer rating of just 24.9 first read passes (31 Pass Attempts) this season — best in NFL; League Avg: 91.4.
- The Bills have averaged 0.76 epa per play on first read passes this season — best in NFL; League Avg: 0.17.
- The Cardinals have averaged 0.54 epa per play on first drive of the game this season — best in NFL; League Avg: 0.01.
- The Titans defense have allowed -0.43 epa per play against play action passes this season — best in NFL; League Avg: 0.04.
- The Saints defense have allowed -0.31 epa per play with a base rush this season — best in NFL; League Avg: -0.05.
- Josh Allen (BUF) has averaged 0.44 epa per play on passing attempts this season — best of 35 qualified NFL QBs; League Avg: -0.04.
- Andy Dalton (CAR) has averaged 0.27 epa per play on passing attempts on Early Downs this season — best of 34 qualified NFL QBs; League Avg: 0.01.
- Sam Darnold (MIN) has averaged 0.99 epa per play on passing attempts on passes to the middle of the field this season — best of 28 qualified NFL QBs; League Avg: 0.05.
- Alec Pierce (IND) has averaged 18.8 yards per target (225 yards/12 targets) this season — best of 77 qualified NFL WRs; League Avg: 7.8.
- The Packers defense has intercepted 7 of 102 attempts (14.6 pass attempts per int.) this season — best in NFL; League Avg: 43.2.